Why This Sector
If you have looked around this site and read the Careers section, it will not be surprising that payment infrastructure is the first sector I chose to write about.
As an analyst at Mizuho Bank, my first project was the ISO 20022 migration — work that connects directly to BOK-Wire+ and the SWIFT network. The migration also brought a new payment product into the bank, which is how I came to work with VAN companies. That is where the idea came from: research the sector I already knew from the inside.
Everything here is built from public sources — DART filings, audited financial statements, Bank of Korea statistics, statute, press reporting, and credit-bureau data for unlisted companies. No confidential or non-public information was used. Nothing in this research represents the views of Mizuho Bank or of any company named in it.
What a PG and a VAN Actually Do
The moment a card is used, the merchant and the card issuer are not talking to each other directly. Two intermediaries sit in between — the PG and the VAN, which are what this research is about.
A VAN — value-added network — is the network that carries payment data safely and accurately. In Korea, wiring eight card issuers to millions of merchants one by one is impossible, so a VAN connects once and routes on everyone's behalf: authorisation, capturing the record of each transaction (sales-slip capture), and terminal support.
A PG — payment gateway — works as the checkout counter for online commerce. Most online merchants cannot contract with card issuers directly, so the PG contracts in their place, receives the money, and settles it to the merchant in a single payment — which takes the confusion out of reconciling several issuers and makes cash flow easy to read.
The fee structure and the flow of funds look like this:
Hold onto one distinction from these diagrams: the VAN moves data; the PG moves money. It is why the sector's biggest realised loss — the TMON–WeMakePrice insolvency — landed on PGs, and why this paper's conclusion is that the binding constraint on a buyout is settlement float.
Only the company's slice got cut — reading gross revenue is reading the wrong number.
* 82–87% across the three names; the 82% end mixes VAN agency costs, issuer/agency split undisclosed.
The merchant fee is taken out on the way down. What is left after the issuer is paid is the PG's real take — its net revenue.
What It Finds
The margin is the mix, not the volume
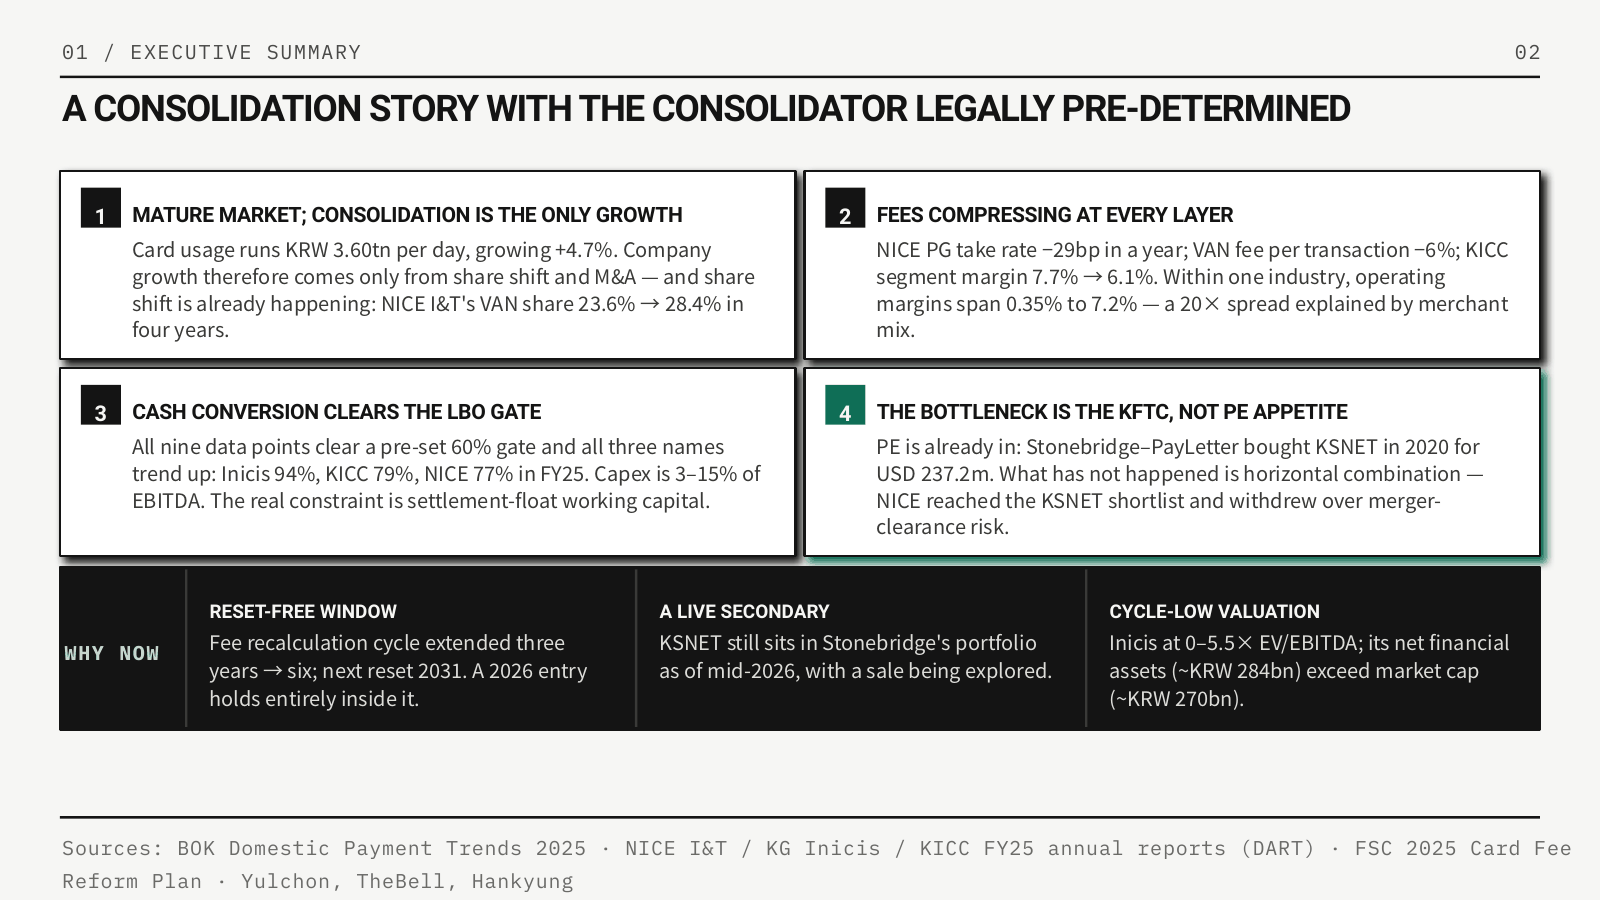
Inside one industry in one year, operating margins run from 0.35% to 7.2% — a twentyfold spread. It tracks merchant mix, not scale: the enterprise-heavy PG bought +33% TPV growth at almost no margin, while the long-tail PG with 190k merchants keeps 7.2%. That turns into a screening rule — enterprise-heavy PGs are volume assets, long-tail PGs are margin assets — and into the first diligence request.
Big money passes through; the slice shrinks faster than the flow
All three names show the same shape: 82–87% of gross revenue is pass-through. The real size of the business is what is left. At one operator gross fee revenue fell 2.3% while net revenue fell 11.8% — five times faster. Only the company's own slice was cut. Any read of this sector that stops at gross revenue is reading the wrong number.
The constraint is settlement float, not capex
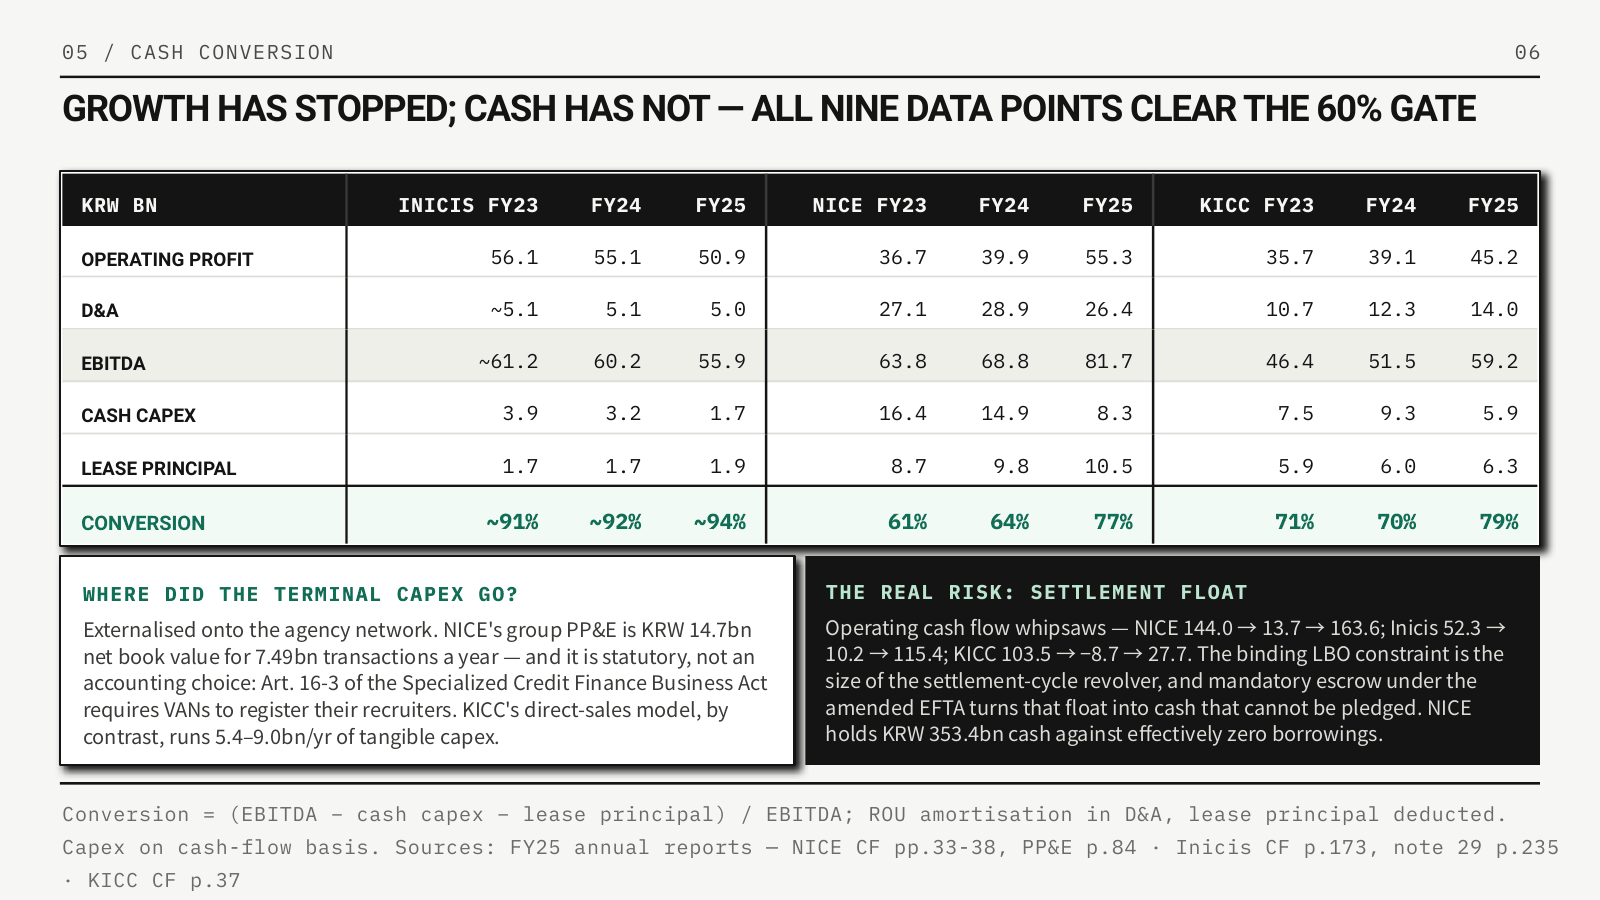
Nine data points — three companies, three years — all clear a 60% cash-conversion gate, and capex is only 3–15% of EBITDA. At the agency-network operator terminal investment is not on the balance sheet at all — the agency network carries it, and the registration regime behind that sits in statute rather than in an accounting choice — while the direct-sales operator does carry terminals itself. That gap is a diligence question, not a footnote. What actually swings is working capital in the settlement cycle, by more than KRW 100bn from one year to the next, and pending rules would make that float unpledgeable.
The consolidator is legally pre-determined
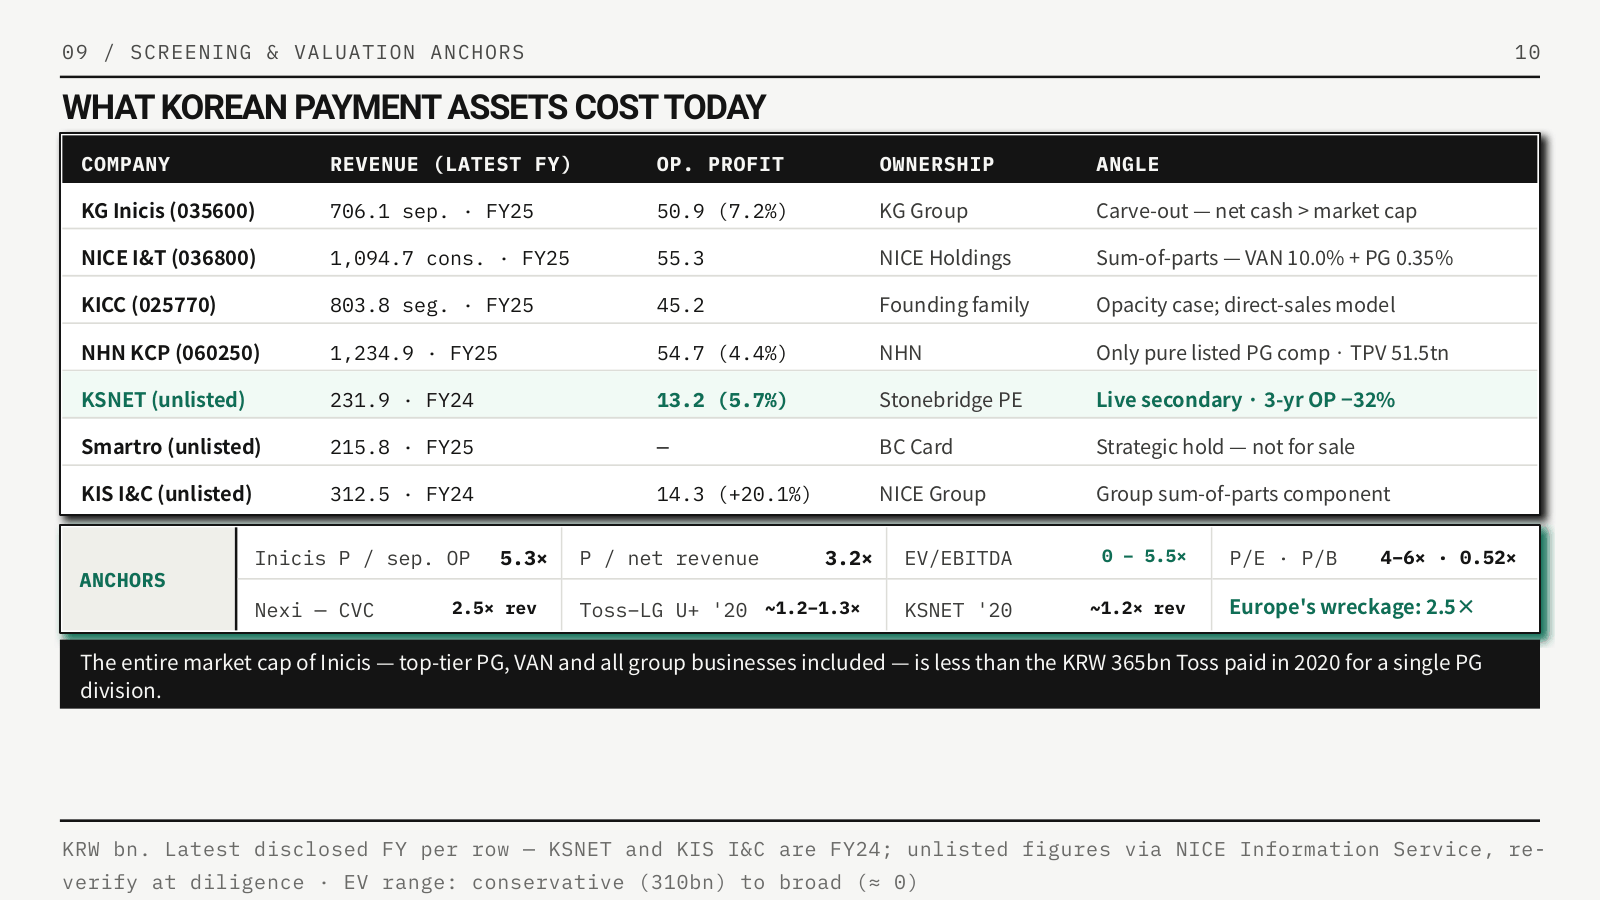
Acquiring is a licensed business here, so the independent-acquirer model that reshaped Europe cannot exist — the global processor that killed Europe's roll-ups is, in Korea, a customer of the local PGs. Private equity has already executed one buyout here, and still holds it. What has not happened is horizontal combination, and the blocker is merger clearance rather than price: the largest domestic operator reached a shortlist and withdrew on exactly that ground. If strategics are blocked by regulation, the consolidator can only be a non-affiliated financial investor.
How It Is Built
The point of the deck is not the conclusion but that every number in it can be checked. Financial figures come from FY25 annual reports on DART, cited to the page; unlisted names come from credit-bureau data, flagged for re-verification at diligence level. Market size comes from Bank of Korea payment statistics; the moat comes from the statute itself; deal values come from the advising counsel's own announcements rather than press estimates.
Two rules do most of the work. Perimeter consistency: a numerator and a denominator must come from the same reporting entity, so separate-basis, group-segment and consolidated figures are never mixed to make a rate look better. And disclosure absence is recorded as a finding: where a company stopped publishing transaction volume in the year its results turned, that silence is written down as diligence item one rather than filled in with an estimate.
Three Pages From It
Read It
The full deck is a single PDF. It is laid out wide for the screen, so a desktop or tablet reads best.
Independent research prepared in a personal capacity. Not investment advice, not a recommendation, and no offer or solicitation. Figures are drawn from public disclosures as of August 2026 and may since have changed.